← All case studies
Australian electricity network · Data platforms

Energy Data Platform Modernisation & Governance

A multi-domain platform programme spanning Fabric administration, Synapse-to-Databricks migration, asset-data governance, real-time ingestion and operational Power BI reporting.
Microsoft FabricAzure DatabricksDelta LakePower BI
Energy Data Platform Modernisation & Governance
Different workloads, shared accountability

Modernisation had to work across the electricity network

Asset, finance and metering workloads came with different sources and migration needs. Each needed reconciliation and a clear reporting owner, not simply a new place to store data.

The programme covered Fabric administration, Synapse-to-Databricks migration, asset-data governance, real-time ingestion and operational Power BI reporting. Platform change and the work of running it were part of the same engagement.

Keep the workstreams distinct

Migration was only one part of the programme

Synapse-to-Databricks migration sat alongside asset and component reconciliation, asset-failure reporting and Meter-to-Cash work. These were related workstreams, not one pipeline through every product.

Prepared data layers and reconciled workload changes supported migration and model design. Fabric data and models supported the Meter-to-Cash work, while asset-failure analysis addressed a different reporting need.

Operate what has been built

Ownership mattered alongside the technology

Shared administration and governance connected the programme. Clear reporting ownership and reconciliation remained important across the different workload changes.

Operational visibility included real-time ingestion and Log Analytics / DevOps integration. Power BI models provided the business reporting.

Process → Architecture → Delivery

Our methodology

  1. 01DiscoverAgree the outcome, the decisions and the requirements.
  2. 02Current stateMap how the work and data flow today, with evidence.
  3. 03Root causesFind what drives the delay, rework or disagreeing numbers.
  4. 04ApproachAgree the target design, scope and measures of success.
  5. 05BuildBuild the process change, model or report the design calls for.
  6. 06OptimiseTest at real volumes; tune speed, cost and usability.
  7. 07ProductioniseRelease with managed deployment, monitoring and support.
  8. 08GovernSet owners, access and controls so it keeps working.
Swimlane process map: To-be: asset ↔ component reconciliation with owned exceptions. The steps are listed below the diagram.
Illustrative reference processTo-be: asset ↔ component reconciliation with owned exceptions In this example, reconciliation runs on every load, exceptions go to a named owner, and failure rates use reconciled components only.
Steps in this diagram

Lanes: Platform (automated), Asset data owner, Field operations, Reliability analyst.

  • Register + failure loads
  • Match components to assets
  • Matched?
  • Triage exception
  • Verify in field
  • Correct register at source
  • Include in failure rates
  • Prioritise program
  • Trusted rates
Architecture diagram: Parallel workstreams on a shared operating foundation. The components are listed below the diagram.
Reference architectureParallel workstreams on a shared operating foundation The Synapse-to-Databricks migration (Delta Lake), asset and component reconciliation, Meter-to-Cash on Fabric data and models, and real-time ingestion are related workstreams. Datasets do not all pass through every product. Administration, ownership, Log Analytics and DevOps are shared.
Components in this design
  • Asset register (assets, components)
  • Meters + SCADA (reads, events)
  • Billing / finance (tariffs, invoices)
  • Synapse (legacy) (migrated out)
  • Event Hubs (real-time ingestion)
  • Fabric pipelines (M2C sources)
  • Azure Databricks (Delta Lake layers)
  • Fabric lakehouse (M2C data)
  • Asset reconciliation (components ↔ assets)
  • Asset model (failures)
  • M2C model (Fabric)
  • Asset reliability (Power BI)
  • Meter-to-Cash (Power BI)
  • Log Analytics (pipeline + platform ops)
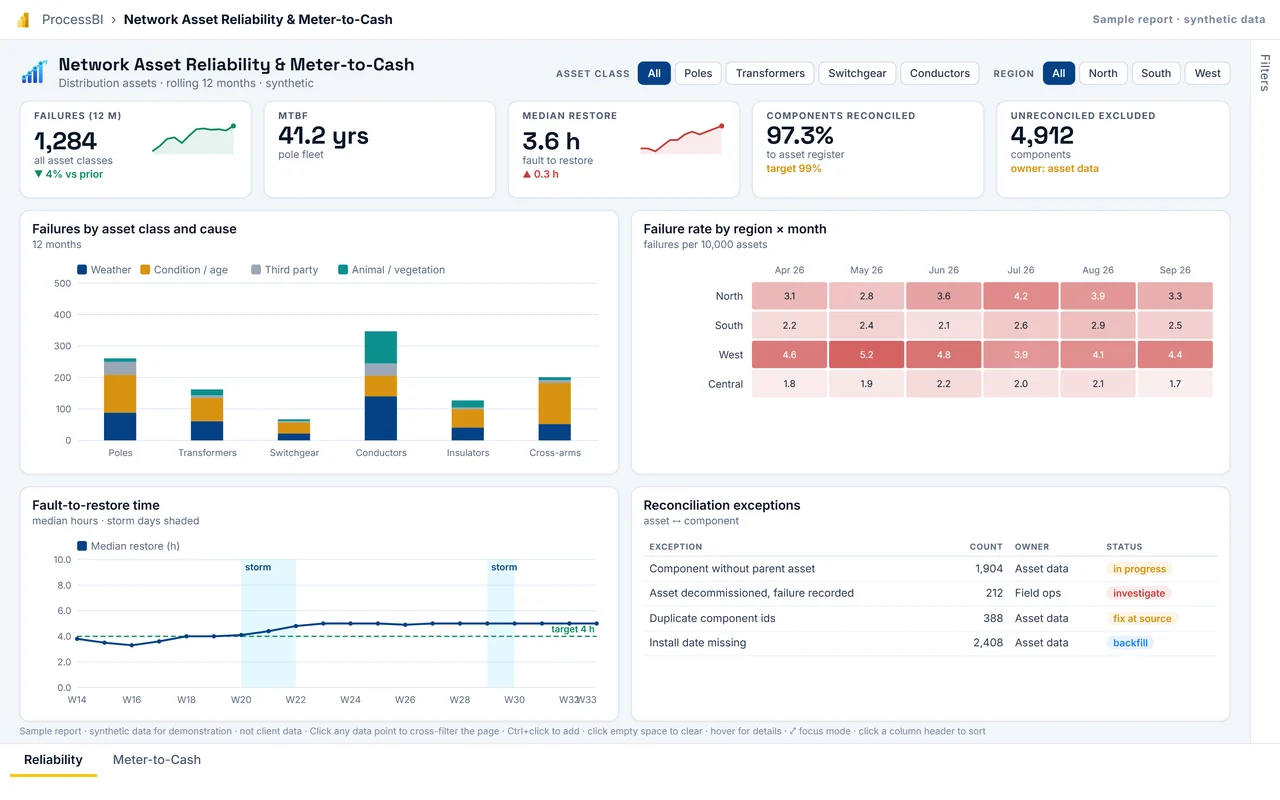
First page of the Network Asset Reliability & Meter-to-Cash sample report
Delivery: interactive Power BI sample reportNetwork Asset Reliability & Meter-to-Cash Show where assets fail, how often and how long they take to restore, on component data that has been reconciled with the asset register. Delivered with named owners, role-based access, release pipelines and a controlled way to change governed measures.
Full screen
Who it is for
Asset management engineers, network reliability manager.
Decision it supports
Prioritise inspection and replacement programs; fix asset-register gaps that distort failure rates.
Report pages
Reliability · Meter-to-Cash

Reference design: how this pattern is typically built on Microsoft services. Component choices for a specific engagement depend on the client's environment and existing licences.

Microsoft icons are used under Microsoft's terms. Icon notices

Synthetic sample data, not client data.

Delivery in view

Delivered capability

Migration + model design

Prepared data layers and reconciled workload changes.

Reusable reporting

Asset-failure analysis and Fabric reporting foundations.

Operational visibility

Real-time ingestion and Log Analytics / DevOps integration.

Outcome reported as delivered scope.

Next step

Migrating platforms without clear reporting ownership?

Tell us what is happening. We agree priorities and scope before proposing any work.