
The problem
The lender's Fabric workload did not need the same amount of compute throughout the day. Overnight ETL and data preparation created a heavy processing window; daytime reporting introduced a different, changing pattern of demand. Holding capacity at the level required for the busiest period meant continuing to pay for that allocation when less work was running. Sizing only for quieter periods would create the opposite risk: important processing and reports might have to wait when demand rose. The problem was to manage that tradeoff without making manual resizing another operational task.
A reservation offers a lower unit price for eligible committed usage, but price and utilisation are different questions. A discounted allocation can still exceed what the workload needs at a particular time. Equally, a consistently busy baseline may be well suited to a reservation. The design therefore needed to follow this client's workload rather than assume one purchasing model is best for every organisation. Predictable overnight demand and unexpected business-hour pressure both had to be considered, along with the point at which it was safe to reduce capacity.
The objective was to use the available allocation effectively before increasing it, then return to a lower run rate when the work allowed. Cost needed to be considered alongside timely data and usable reports. As reporting and AI use expand, that decision remains a workload-management question rather than a one-off choice of capacity size.
The solution
ProcessBI implemented a near-real-time control loop around Fabric capacity telemetry. It evaluates current and smoothed consumption, recognises predictable windows such as overnight ETL, and watches business-hour demand for sustained pressure that could lead to throttling.
The control policy does not treat every short spike as a reason to buy more capacity. It first makes effective use of the current allocation, then resizes within approved limits when demand persists. Cooldown rules, operational logging, alerts and a manual override protect critical reporting and refresh windows.
The implementation plan
A controlled sequence from workload evidence to accountable scaling.
Capacity behaviour and cost
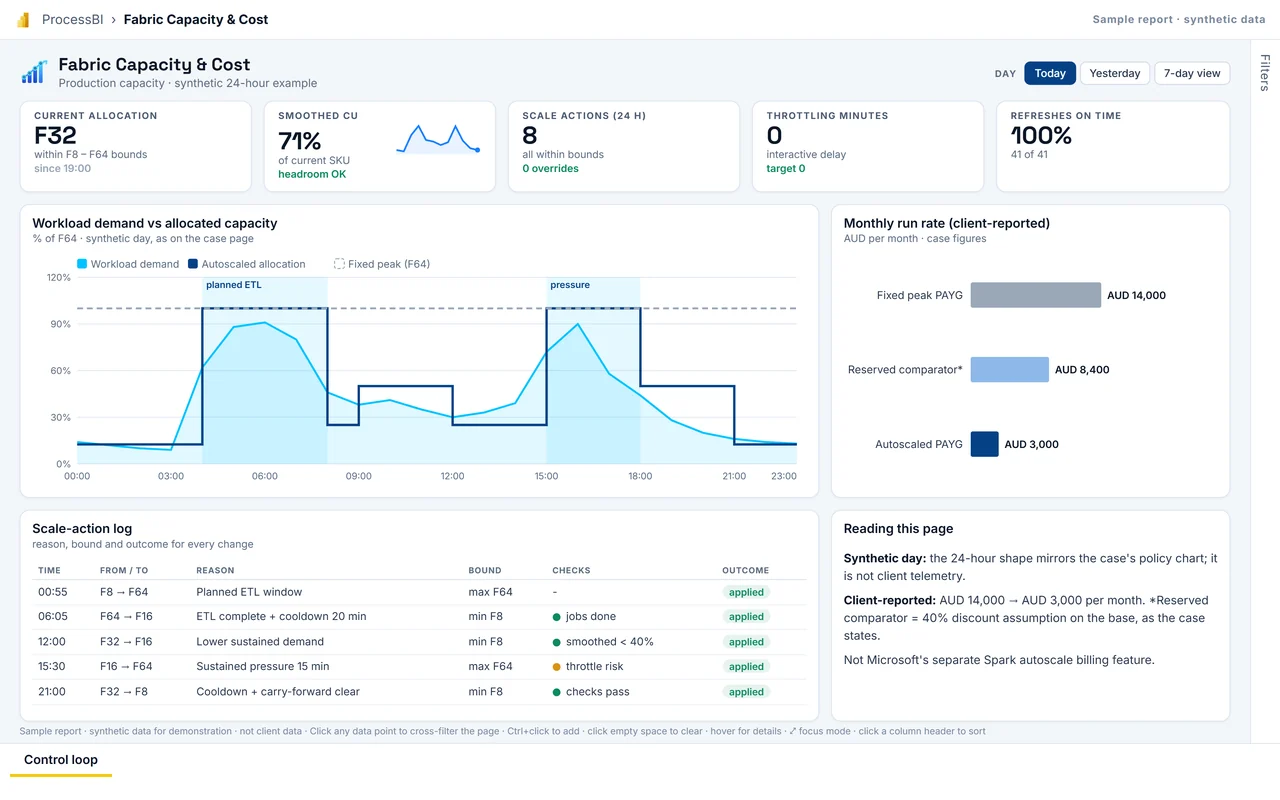
The 24-hour pattern explains the control logic. The monthly cost comparison uses the client-supplied figures.
A responsive 24-hour capacity policy
The chart shows how a control policy can respond to workload shape without holding peak capacity all day.
Monthly run-rate comparison
AUD per month. The reserved figure is a 40% discount applied to the AUD 14,000 base, as specified for this comparison.
Microsoft currently advertises approximately 41% reservation savings versus pay-as-you-go; actual regional pricing and reservation coverage vary. Microsoft Fabric pricing ↗
| Monthly operating model | Basis | Run rate |
|---|---|---|
| Fixed peak pay-as-you-go | Owner-supplied base comparator | AUD 14,000 |
| Reserved capacity comparator | 60% of the base after a 40% discount | AUD 8,400 |
| Autoscaled pay-as-you-go | Client-reported engagement result | AUD 3,000 |
Benefits analysis
The value came from matching capacity to service demand, not simply choosing the lowest unit price.
Our methodology
- 01DiscoverAgree the outcome, the decisions and the requirements.
- 02Current stateMap how the work and data flow today, with evidence.
- 03Root causesFind what drives the delay, rework or disagreeing numbers.
- 04ApproachAgree the target design, scope and measures of success.
- 05BuildBuild the process change, model or report the design calls for.
- 06OptimiseTest at real volumes; tune speed, cost and usability.
- 07ProductioniseRelease with managed deployment, monitoring and support.
- 08GovernSet owners, access and controls so it keeps working.

Steps in this diagram
Lanes: Workloads, Platform admin, Report users.
- Day starts
- Hold peak capacity all day
- Idle headroom most hours
- Ad-hoc manual resize
- Throttled reports if sized down
- No record of why

Steps in this diagram
Lanes: Telemetry (automated), Policy engine, Platform owner, Fabric capacity.
- Every minute
- Smoothed CU + windows
- Sustained pressure / window?
- Scale up within max
- Jobs done + cooldown?
- Scale down within min
- Resize applied
- Reason + bound logged
- Override for critical period
- Auditable decision

Components in this design
- Fabric capacity (F-SKU, Azure resource)
- Workspace monitoring (CU, throttling, jobs)
- Eventstream (30-second timepoints)
- Eventhouse (smoothed CU, windows)
- Manual override (Teams adaptive card)
- Policy engine (bounds, cooldown, windows)
- Policy config (min/max, ETL windows)
- Resize via ARM API (resizes the F-SKU (managed identity))
- Log Analytics (action log + alerts)
- Control-loop report (sample report on this page)
Reference design: how this pattern is typically built on Microsoft services. Component choices for a specific engagement depend on the client's environment and existing licences.
Microsoft icons are used under Microsoft's terms. Icon notices
Synthetic sample data, not client data.
The outcome
Paying for peak Fabric capacity all day?
Tell us what is happening. We agree priorities and scope before proposing any work.