← All case studies
shipbuilding organisation · Project analytics

Project Management, Quotation & Billing Dashboard

A decision-focused reporting layer over the project-management system, connecting project position with quotation, milestone and billing information.

Project data integrationDimensional modellingQuotation analyticsBilling analytics
Cranes lifting a large red hull section at a shipyard.
The project and its commercial context

Project status could not tell the whole story

A shipbuilding project had quotation, delivery and billing information to consider alongside its operational status. Management needed those views connected around the same project record.

The dashboard used common project relationships to bring the commercial and operational context together. The existing operational system remained the source, rather than creating another project record to maintain.

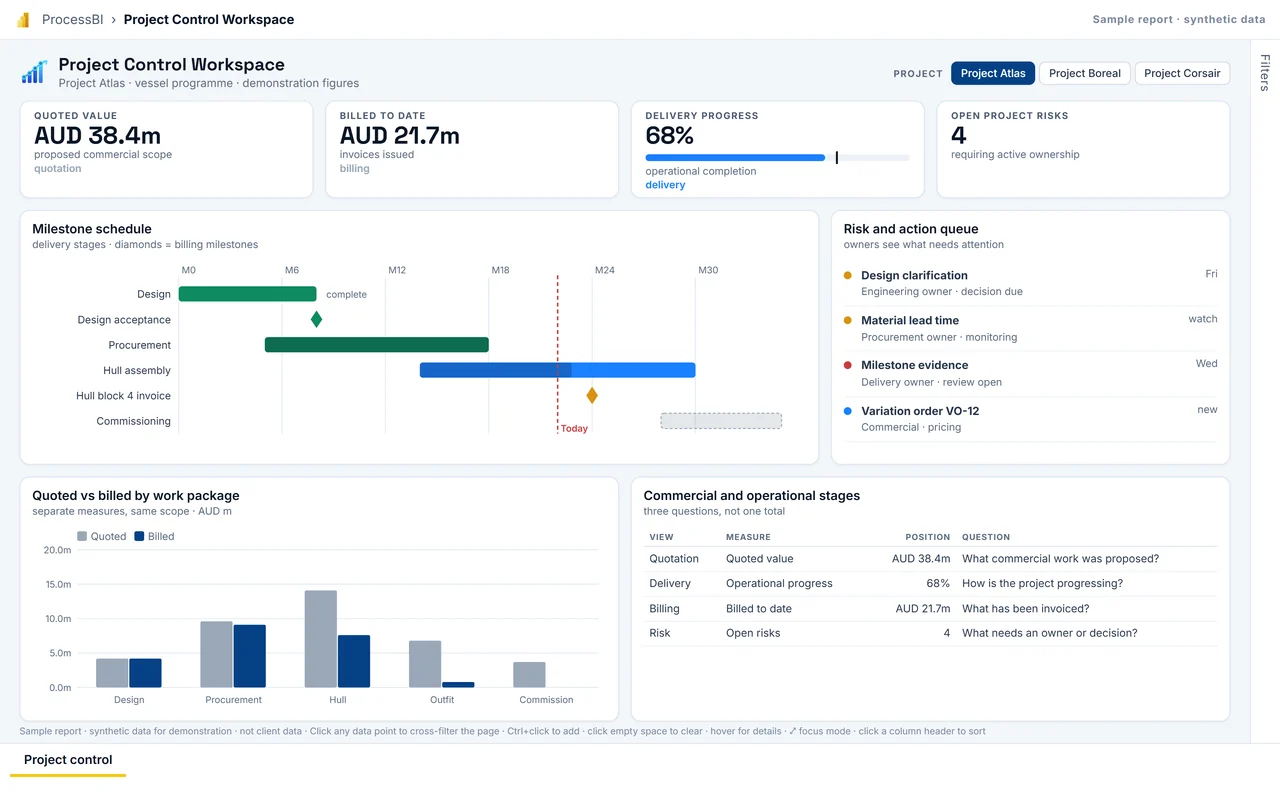
The interactive Power BI sample report further down this page shows how quotation, delivery and billing views work together without becoming one total.

Three questions, not one total

Keep the meaning of each measure intact

What was proposed, how was the project progressing, and what had been billed? Those are different questions about the same project.

The dashboard connected quotation, milestone and billing information without treating their measures as interchangeable. A quotation value is not a billed amount, and delivery progress describes another stage.

Connect the view, retain the record

One operational source beneath the dashboard

Common project relationships were the link between the views. Management could read commercial records beside operational progress without making the dashboard a second project system.

The result was a connected management view with clear measures and one operational source.

Process → Architecture → Delivery

Our methodology

  1. 01DiscoverAgree the outcome, the decisions and the requirements.
  2. 02Current stateMap how the work and data flow today, with evidence.
  3. 03Root causesFind what drives the delay, rework or disagreeing numbers.
  4. 04ApproachAgree the target design, scope and measures of success.
  5. 05BuildBuild the process change, model or report the design calls for.
  6. 06OptimiseTest at real volumes; tune speed, cost and usability.
  7. 07ProductioniseRelease with managed deployment, monitoring and support.
  8. 08GovernSet owners, access and controls so it keeps working.
Swimlane process map: To-be: milestone evidence to invoice. The steps are listed below the diagram.
Illustrative reference processTo-be: milestone evidence to invoice In this example, billing follows delivery evidence and the dashboard reads each stage from its own record.
Steps in this diagram

Lanes: Delivery owner, Project controls, Commercial, Customer.

  • Milestone reached
  • Attach completion evidence
  • Review evidence
  • Complete?
  • Close gaps
  • Raise milestone invoice
  • Accept + pay
  • Records update; dashboard reads
  • Billed matches delivery
Architecture diagram: Reporting layer over the operational project system. The components are listed below the diagram.
Reference architectureReporting layer over the operational project system The engagement was technology-neutral; this is a Microsoft reference design: read-only extraction from the project system, conformed dimensions in Gold, and Power BI with no write-back, so the dashboard never becomes a second project record.
Components in this design
  • Project system (authoritative record)
  • Finance / ERP (quotes, invoices)
  • Pipelines (scheduled extract)
  • Silver (conformed project keys)
  • Gold (3 facts, shared dims)
  • Semantic model (separate measures)
  • Project control (Power BI)
  • Monthly pack (paginated report)
First page of the Project Control Workspace sample report
Delivery: interactive Power BI sample reportProject Control Workspace Give programme management one view of what was proposed, how delivery is progressing and what has been invoiced, without mixing the three measures. Delivered with named owners, role-based access, release pipelines and a controlled way to change governed measures.
Full screen
Who it is for
Programme director, project controls, commercial manager.
Decision it supports
Where to act on delivery risk; when to raise milestone invoices.
Report pages
Project control

Reference design: how this pattern is typically built on Microsoft services. Component choices for a specific engagement depend on the client's environment and existing licences.

Microsoft icons are used under Microsoft's terms. Icon notices

Synthetic sample data, not client data.

Delivery in view

Delivered capability

Common project context

Connect the commercial and operational record.

Clear measures

Preserve the meaning of quotation, delivery and billing.

One operational source

Avoid a second project record to maintain.

Outcome reported as delivered scope.

Next step

Can’t see quotation, delivery and billing together?

Tell us what is happening. We agree priorities and scope before proposing any work.