← All case studies
Superannuation administration provider · Reporting & automation

Superannuation Reporting & Process Automation

Reporting and workflow delivery supporting major Australian superannuation funds, with reconciled data, repeatable reporting and Power Automate integration.
Power BIPower AutomateAzure SQLAzure Data Factory
Superannuation Reporting & Process Automation
Behind the reporting cycle

A report depended on more than the dashboard

At a superannuation administration provider, reporting relied on recurring preparation, system interactions and database changes. Manual work behind the dashboard made that path harder to manage.

The engagement brought Power BI delivery together with process automation, data pipelines, database design and migration testing. It addressed the work producing the report as well as the report itself.

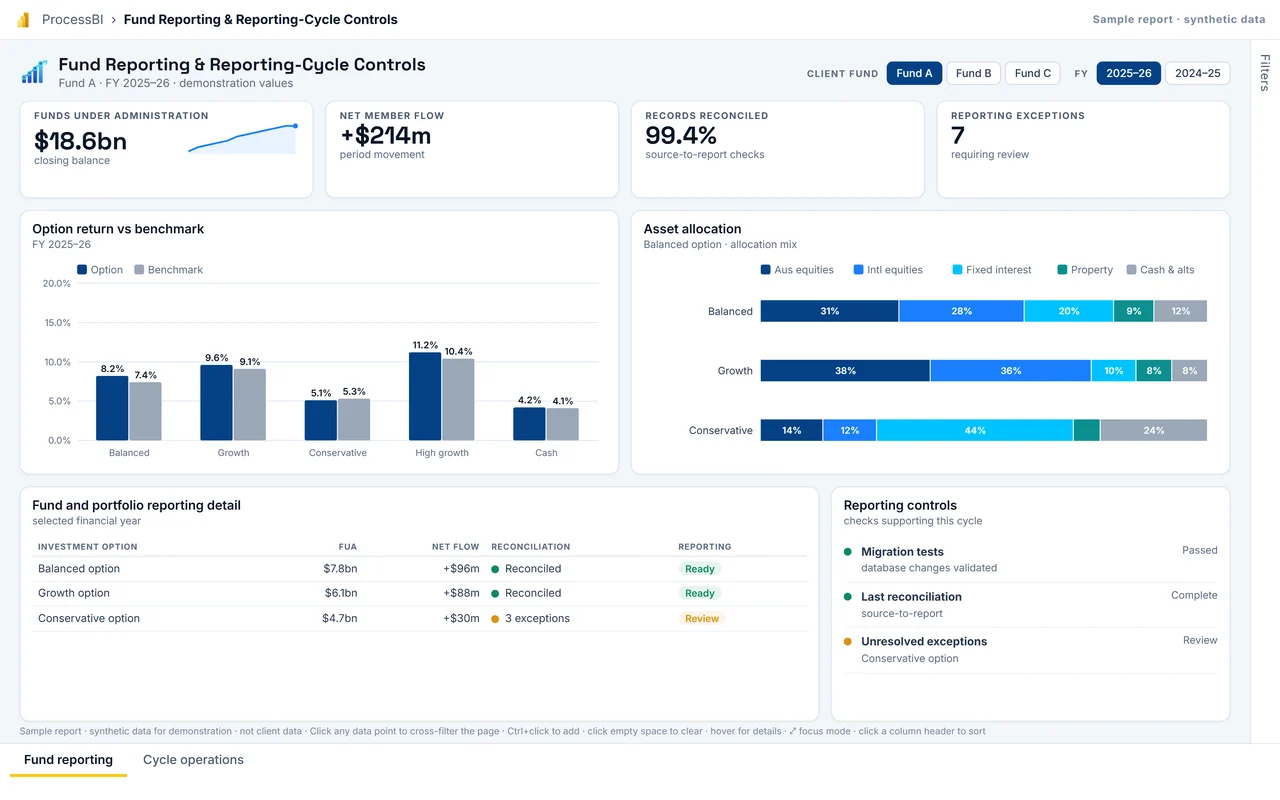
The interactive Power BI sample report further down this page shows how client and portfolio reporting is organised, with the controls behind each result.

Work upstream of the report

Separate recurring actions from data preparation

Recurring administration interactions were handled through Power Automate RPA. This was a distinct part of the delivery, alongside the data-pipeline work in SSIS and Azure Data Factory.

SQL database design and migration supported the reporting foundation. Keeping these roles clear explains why a reporting engagement also involved automation and database work.

Check the changes behind the numbers

Reporting and migration validation belonged together

Database changes were accompanied by migration testing and report tests. Power BI reporting was delivered alongside that validation, rather than described in isolation from its data foundation.

The delivery combined repeatable reporting, automated administration interactions and tested database migration within the administration provider.

Process → Architecture → Delivery

Our methodology

  1. 01DiscoverAgree the outcome, the decisions and the requirements.
  2. 02Current stateMap how the work and data flow today, with evidence.
  3. 03Root causesFind what drives the delay, rework or disagreeing numbers.
  4. 04ApproachAgree the target design, scope and measures of success.
  5. 05BuildBuild the process change, model or report the design calls for.
  6. 06OptimiseTest at real volumes; tune speed, cost and usability.
  7. 07ProductioniseRelease with managed deployment, monitoring and support.
  8. 08GovernSet owners, access and controls so it keeps working.
Swimlane process map: To-be: monthly reporting cycle with automated preparation and gated release. The steps are listed below the diagram.
Illustrative reference processTo-be: monthly reporting cycle with automated preparation and gated release RPA and pipelines prepare the data, reconciliation runs automatically, people review only the exceptions, and tests gate release to each fund.
Steps in this diagram

Lanes: Automation (RPA + pipelines), Reporting analyst, Platform team, Client fund.

  • Month end
  • Run admin extracts
  • Load + transform
  • Source-to-report reconciliation
  • Exceptions?
  • Review + resolve exceptions
  • Report + migration tests
  • Receive reports
  • Cycle closed
Architecture diagram: Reporting foundation with automation upstream. The components are listed below the diagram.
Reference architectureReporting foundation with automation upstream Power Automate RPA handles recurring administration interactions. SSIS and Azure Data Factory prepare the data, Azure SQL holds the reporting model and the control schema, and migration and report tests gate each release. The tools have distinct roles; the operating sequence follows the administration process.
Components in this design
  • Admin system (member records)
  • Unit prices / files (custodian feeds)
  • Power Automate RPA (recurring interactions)
  • SSIS (existing packages)
  • Azure Data Factory (pipelines)
  • Azure SQL (reporting + control schema)
  • Migration tests (database changes)
  • Report tests (reporting changes)
  • Power BI (fund reporting, RLS)
First page of the Fund Reporting & Reporting-Cycle Controls sample report
Delivery: interactive Power BI sample reportFund Reporting & Reporting-Cycle Controls Report funds under administration, member flows, option performance against benchmark and allocation, and show the reconciliation and test controls behind each cycle. Delivered with named owners, role-based access, release pipelines and a controlled way to change governed measures.
Full screen
Who it is for
Fund reporting team, client relationship managers, operations.
Decision it supports
Release the cycle's reports; chase the exceptions blocking release.
Report pages
Fund reporting · Cycle operations

Reference design: how this pattern is typically built on Microsoft services. Component choices for a specific engagement depend on the client's environment and existing licences.

Microsoft icons are used under Microsoft's terms. Icon notices

Synthetic sample data, not client data.

Delivery in view

Delivered capability

Reporting foundation

Database design and a clear data-preparation path.

Repeated tasks automated

RPA for recurring administration interactions.

Tested migration

SQL migration and validation alongside Power BI delivery.

Outcome reported as delivered scope.

Next step

Is manual work holding up the reporting cycle?

Tell us what is happening. We agree priorities and scope before proposing any work.