
Make the quality record useful.
More than 150 spreadsheets held inspection results and production history. Investigating an issue meant finding the right files, reconciling records and piecing together what had happened.
One shared database changed the starting point. The wider redesign connected quality assurance, production systems, follow-up and analysis—so the record could support a decision, not just store a result.
Keep the whole quality story together.
Nonconformance reports (NCRs) were issued and tracked alongside rework and product recalls. The team could connect a quality concern with its production context and the action taken to address it.
That history supported earlier root-cause analysis. It also gave ongoing performance and formulation reviews a stronger basis: what happened, what changed, and what needed another look.
Connect the evidence to the paperwork.
The work extended to quality-assurance documentation and issuing Certificates of Conformance for international exports. SharePoint integration made assurance part of the connected quality process.
Power Automate handled notifications, alerts and reminders. Desktop RPA bridged legacy applications, helping keep data and systems in sync without replacing every application the manufacturer relied on.
Export documentation was a delivered capability.
Watch quality and productivity together.

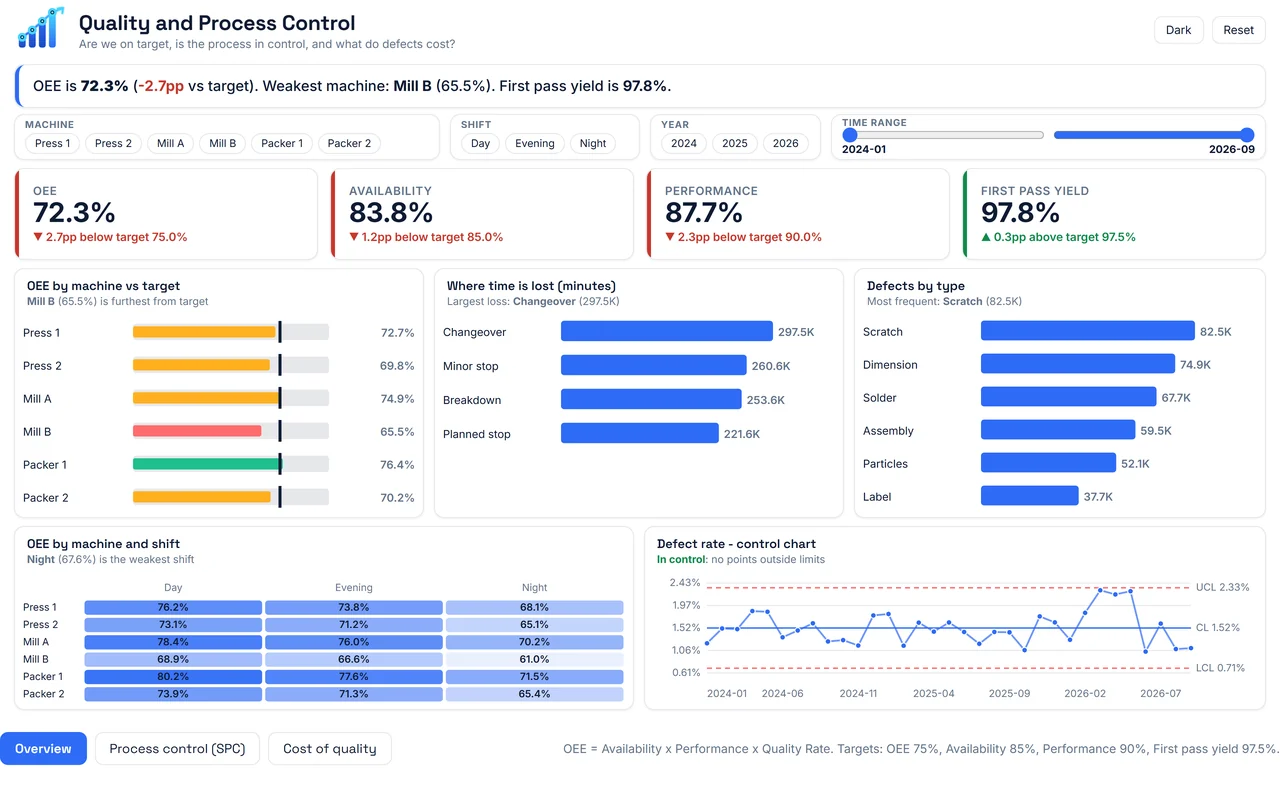
Power BI reporting brought the cost of poor quality and productivity into view. Process control charts helped monitor variation and identify signals for investigation, keeping attention on both product quality and production performance.
NCRs, recalls and rework history.
The impact of defects and corrective work.
Performance alongside quality variation.
Another way to investigate production issues.
Machine-learning model generation complemented the reporting and process-control work, supporting earlier root-cause investigation. It formed part of the wider effort to improve performance and formulations.
Our methodology
- 01DiscoverAgree the outcome, the decisions and the requirements.
- 02Current stateMap how the work and data flow today, with evidence.
- 03Root causesFind what drives the delay, rework or disagreeing numbers.
- 04ApproachAgree the target design, scope and measures of success.
- 05BuildBuild the process change, model or report the design calls for.
- 06OptimiseTest at real volumes; tune speed, cost and usability.
- 07ProductioniseRelease with managed deployment, monitoring and support.
- 08GovernSet owners, access and controls so it keeps working.

Steps in this diagram
Lanes: Production, QA inspector, Quality engineer, Export / customer.
- Defect observed
- Record in a spreadsheet
- Find the right files
- Reconcile versions
- Late root-cause analysis
- Certificate assembled by hand
- Shipment delayed

Steps in this diagram
Lanes: Production, Quality system (automated), Quality engineer, Export / customer.
- Batch inspected
- Capture once (Access form)
- Shared quality record
- In spec?
- NCR with SAP context
- Alerts + reminders
- Corrective action / rework / recall
- Issue CoC from evidence
- Released with evidence

Steps in this diagram
- Record defect
- Gather records
- Root cause
- Corrective action
- Close + certify

Components in this design
- Microsoft Access (inspection capture)
- SAP® software (manufacturing context)
- Legacy applications (production systems)
- Power Automate Desktop (keeps legacy apps in sync)
- Azure SQL Database (one quality database)
- Power Automate (notifications, alerts, reminders)
- SharePoint (QA documents, CoCs)
- Power BI (quality, cost, productivity)
- Model development (runtime not established)
Reference design: how this pattern is typically built on Microsoft services. Component choices for a specific engagement depend on the client's environment and existing licences.
Microsoft icons are used under Microsoft's terms. Icon notices
Sample data is synthetic and shows how the reporting is structured; it is not client data.
Process redesign, integration and follow-through.
The value came from connecting these disciplines. Consolidation made the information usable; workflow, traceability and analysis made it part of daily quality management.
Shared quality records
An Access capture interface and Azure SQL database replaced spreadsheet-based capture, connecting inspection information with the wider manufacturing environment.
Assurance and export documents
SharePoint integration supported quality assurance. Certificates of Conformance were issued for international exports as part of the documentation process.
NCRs, rework and recalls
Traceable issue and response records supported investigation, corrective action and ongoing review of quality performance.
Cloud workflows and Desktop RPA
Power Automate supported synchronisation and follow-up. Desktop automation connected legacy systems, while notifications, alerts and reminders kept work visible.
Power BI and process control
Reports connected the cost of poor quality with productivity. Process control charts supported variation monitoring and investigation of production issues.
Models and continuous improvement
Model-development work added analytical capability. Investigation findings, rework and recall history informed ongoing performance and formulation review.
Is quality history spread across spreadsheets?
Tell us what is happening. We agree priorities and scope before proposing any work.