← All servicesUnderstand & Redesign
Measure the cause. Test the change.

Lean Six Sigma & Process Improvement

Identify the causes of delay, waste and variation. Test improvements and establish measures that keep them working.
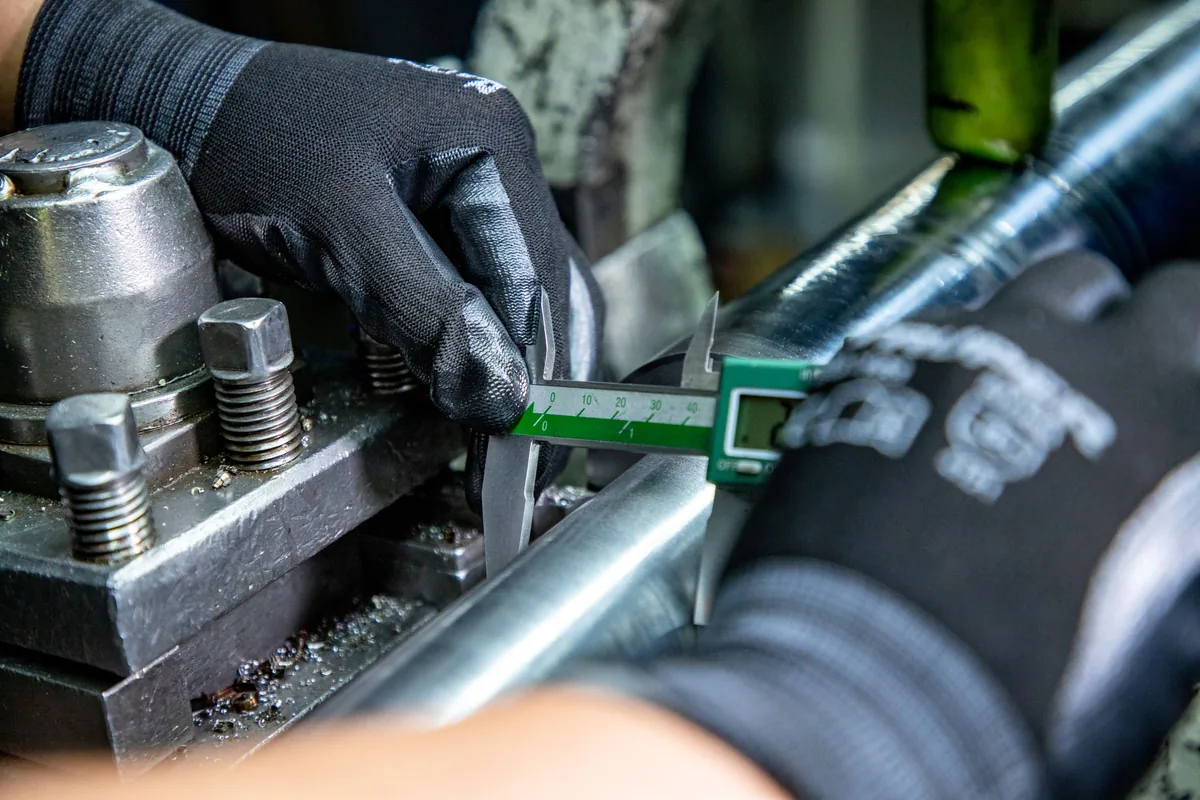
Gloved hands measuring a metal component with a vernier caliper at a machine.

Stop the same defect coming back.

A missed deadline gets a workaround, but next week the queue builds again. We establish a baseline, investigate the constraint and test a change against comparable work before making it the new standard.

Core service capabilities

Business Process Improvement & Redesign

Gap Analysis & Root Cause

Separate symptoms from causes using observations, process evidence and tests of the explanation.

Process Benchmarking

Compare cycle time, service levels, rework and variation for equivalent work, not unlike averages.

Lean Six Sigma Delivery

Use Define, Measure, Analyse, Improve and Control to keep a scoped operational problem moving towards a tested change.

Quality & Continuous Improvement

Set control measures, corrective actions and review ownership so a successful trial does not quietly disappear.

Improvement focus

Investigate repeated entry, waiting or defects separately. Each needs a baseline and a testable explanation, not a promised percentage saving.

Process → Architecture → Delivery

Our methodology

  1. 01DiscoverAgree the outcome, the decisions and the requirements.
  2. 02Current stateMap how the work and data flow today, with evidence.
  3. 03Root causesFind what drives the delay, rework or disagreeing numbers.
  4. 04ApproachAgree the target design, scope and measures of success.
  5. 05BuildBuild the new process, with owners, controls and the measures that track it.
  6. 06OptimiseTest at real volumes; tune speed, cost and usability.
  7. 07ProductioniseRelease with managed deployment, monitoring and support.
  8. 08GovernSet owners, access and controls so it keeps working.
Swimlane process map: DMAIC as a governed workflow (with the failed-pilot loop). The steps are listed below the diagram.
Process redesign 1 of 2DMAIC as a governed workflow (with the failed-pilot loop) Each stage has an exit check. A pilot that fails its like-for-like comparison returns to Analyse; Control assigns an owner, a measure and a reopen trigger.
Steps in this diagram

Lanes: Sponsor, Improvement lead, Process team, Process owner.

  • Problem raised
  • Define scope + 'on time'
  • Measure baseline (equivalent work)
  • Analyse: test causes vs evidence
  • Pilot change
  • Better than control?
  • Approve standard
  • Control plan: owner, measure, trigger
  • Review cycle
  • Sustained
Value-stream map: Value stream: order to dispatch (current state). The steps are listed below the diagram.
Process redesign 2 of 2Value stream: order to dispatch (current state) Illustrative. Credit hold and stock shortage waits dominate; picking and packing are not the constraint.
Steps in this diagram
  • Order entry
  • Credit check
  • Allocate stock
  • Pick & pack
  • Dispatch
Architecture diagram: Improvement measurement stack. The components are listed below the diagram.
Reference architectureImprovement measurement stack ERP orders and the control-plan list feed one model. Run-rule alerts reach the owner named in the control plan; the report is never the only place a signal appears.
Components in this design
  • ERP orders (order + dispatch dates)
  • Control plan list (SharePoint list)
  • Dataflow Gen2 (daily incremental)
  • Fabric warehouse (orders, causes, phases)
  • Semantic model (SPC + Pareto measures)
  • DMAIC report (Deneb control chart)
  • Activator rule (run-rule signal)
  • Control owner (Teams alert + action)
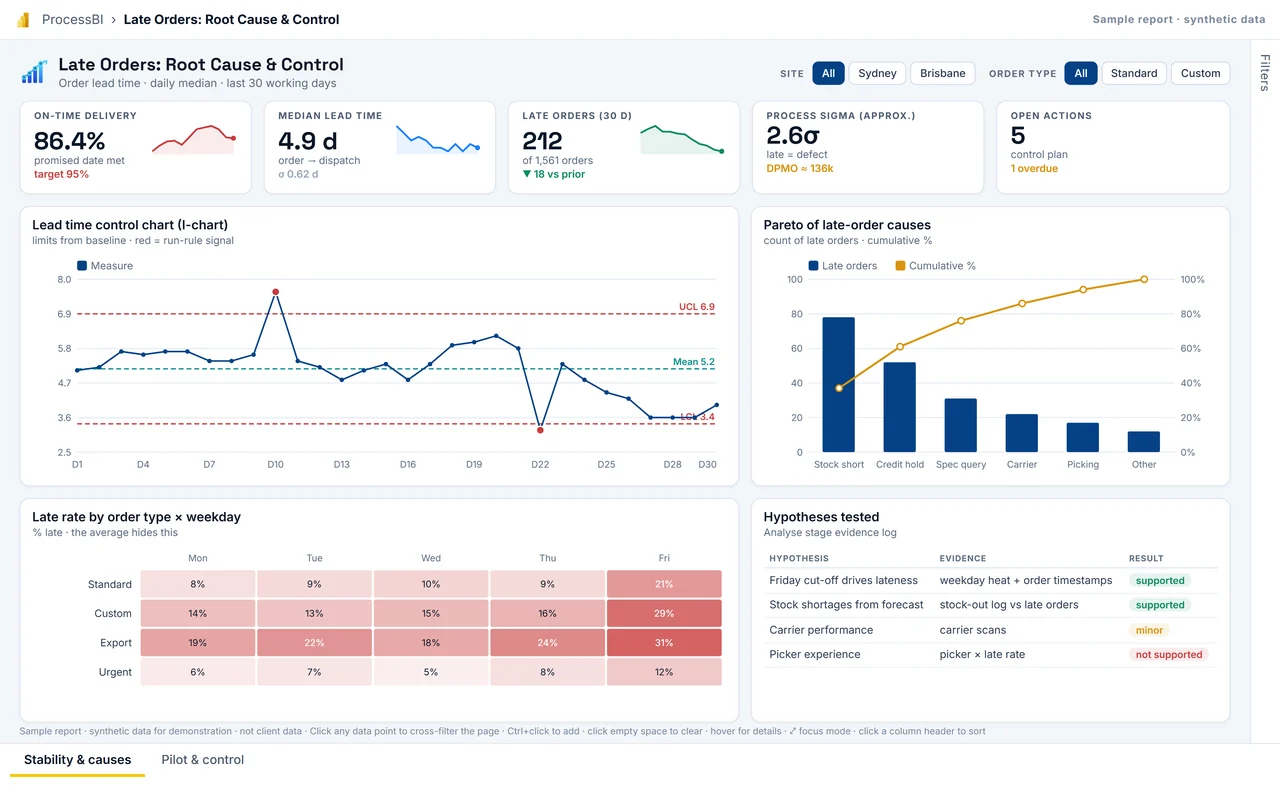
First page of the Late Orders: Root Cause & Control sample report
Delivery: interactive Power BI sample reportLate Orders: Root Cause & Control Show whether order lead time is stable, which causes drive late orders, and whether the piloted change is better than comparable work before it becomes the standard. Delivered with named owners, role-based access, release pipelines and a controlled way to change governed measures.
Full screen
Who it is for
Improvement lead (Green/Black Belt), operations manager, process owner.
Decision it supports
Roll out, extend or abandon the pilot; when to reopen the investigation.
Report pages
Stability & causes · Pilot & control

Microsoft icons are used under Microsoft's terms. Icon notices

Synthetic sample data. Click any bar, point or row to cross-filter; use the tabs at the bottom to change page.

Next step

Is the same defect or delay coming back?

Tell us what is happening. We agree priorities and scope before proposing any work.