← All servicesUnderstand & Redesign
Work, waiting and hand-offs

Process Mapping & Business Process Redesign

Find where work stalls, repeats or loses ownership. Redesign the process around clear decisions and effective hand-offs.

Colleagues discussing a process on a flipchart beside a work-in-progress board.

Find the waits. Redesign the hand-offs.

A request moves between teams, comes back for missing information and waits in another inbox. We map the real decisions and hand-offs, then agree who owns the next step—before choosing technology.

Core service capabilities

Business Process Improvement & Redesign

End-to-End Process Mapping

BPMN swimlanes show who acts, where decisions happen, which systems are involved and how exceptions return to the flow.

Business Process Reengineering

Rethink duplicated checks, unnecessary hand-offs and fragmented information when small adjustments will not address the underlying problem.

Future-State Design

Agree the new sequence, decision rights, process owner and standard work, with a practical route from design to adoption.

Request journey

Check information at intake, send a complete request to the decision owner and give exceptions a named return path.

Process → Architecture → Delivery

Our methodology

  1. 01DiscoverAgree the outcome, the decisions and the requirements.
  2. 02Current stateMap how the work and data flow today, with evidence.
  3. 03Root causesFind what drives the delay, rework or disagreeing numbers.
  4. 04ApproachAgree the target design, scope and measures of success.
  5. 05BuildBuild the new process, with owners, controls and the measures that track it.
  6. 06OptimiseTest at real volumes; tune speed, cost and usability.
  7. 07ProductioniseRelease with managed deployment, monitoring and support.
  8. 08GovernSet owners, access and controls so it keeps working.
Swimlane process map: As-is: a service request today. The steps are listed below the diagram.
Process redesign 1 of 3As-is: a service request today No intake check, so assessment discovers missing information and returns the request. Complete work then waits in a decision queue nobody tracks.
Steps in this diagram

Lanes: Requester, Service desk, Assessor, Decision owner.

  • Need arises
  • Submit request (no check)
  • Log in inbox
  • Assess request
  • Complete?
  • Find missing info
  • Untracked queue
  • Decide
  • Record reason?
  • Requester chases
Swimlane process map: To-be: intake check, criteria-based assessment, owned decision queue. The steps are listed below the diagram.
Process redesign 2 of 3To-be: intake check, criteria-based assessment, owned decision queue Gaps are returned at intake, complete requests reach an assessor with agreed criteria, and a named owner tracks the decision queue with an ageing alert.
Steps in this diagram

Lanes: Requester, Intake (automated), Assessor, Decision owner.

  • Need arises
  • Submit via guided form
  • Check required information
  • Complete?
  • Fix gap at intake (same day)
  • Assess against agreed criteria
  • Owned queue, alert at 2 days
  • Decide + record reason
  • Notify requester
  • Outcome known
Value-stream map: Value stream: one service request (current state). The steps are listed below the diagram.
Process redesign 3 of 3Value stream: one service request (current state) Illustrative baseline. Touch time is under 3 hours, but waiting dominates; the decision queue is the constraint.
Steps in this diagram
  • Submit
  • Intake review
  • Assessment
  • Decision
  • Notify
Architecture diagram: Process event-log data path. The components are listed below the diagram.
Reference architectureProcess event-log data path Request activity from forms, email and the workflow tool lands as an event log in OneLake, so elapsed, touch and rework time are measured from evidence rather than estimated.
Components in this design
  • Request form (Power Apps / Forms)
  • Shared mailbox (requests by email)
  • Intake check flow (required-info rules)
  • Dataverse (case + activity log)
  • Fabric pipeline (incremental copy)
  • Event-log lakehouse (Bronze → Silver)
  • Event-log notebook (case/activity/timestamp)
  • Semantic model (Direct Lake)
  • Journey report (Power BI)
  • Queue alerts (owner at 2 days)
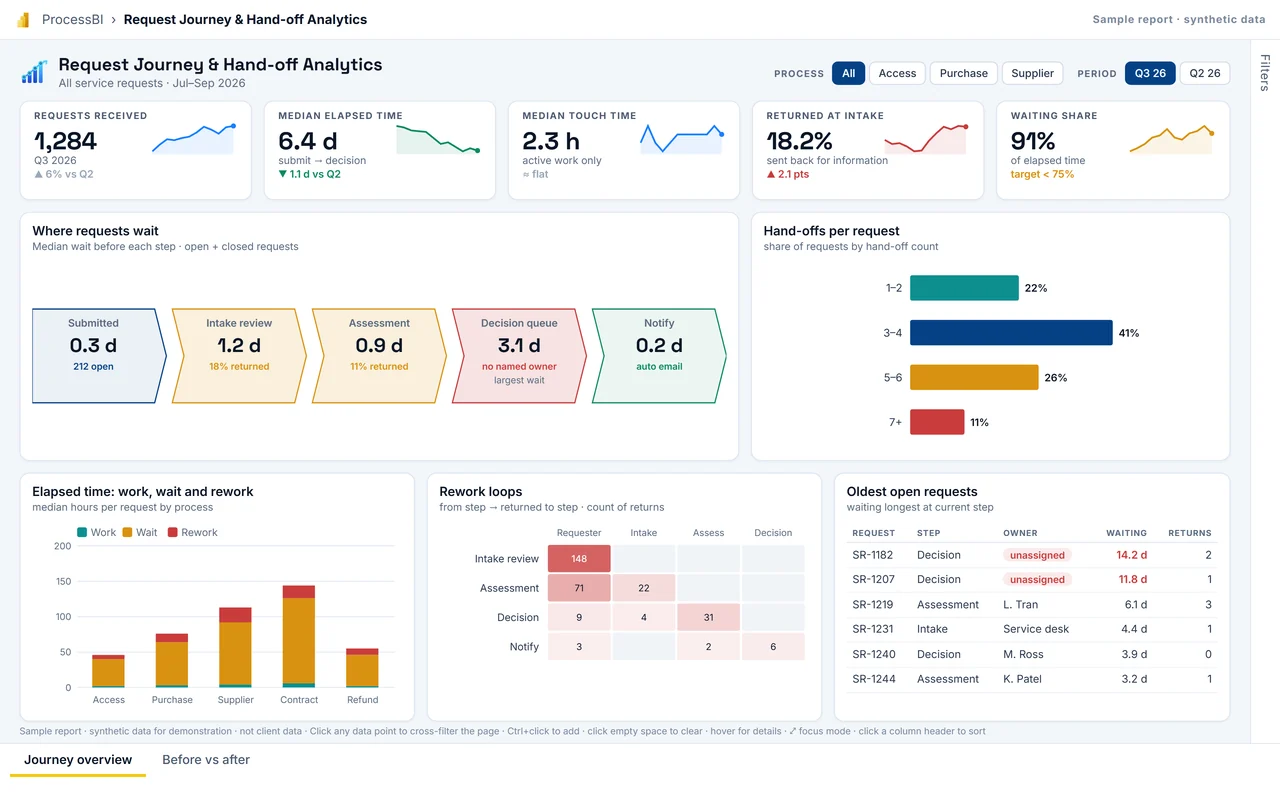
First page of the Request Journey & Hand-off Analytics sample report
Delivery: interactive Power BI sample reportRequest Journey & Hand-off Analytics Give process owners a measured baseline of how requests actually flow, then track whether the redesigned intake check and owned decision queue reduce returns and waiting. Delivered with named owners, role-based access, release pipelines and a controlled way to change governed measures.
Full screen
Who it is for
Process owner, operations manager, improvement lead.
Decision it supports
Which hand-off or queue to redesign first, and whether the redesign is holding.
Report pages
Journey overview · Before vs after

Microsoft icons are used under Microsoft's terms. Icon notices

Synthetic sample data. Click any bar, point or row to cross-filter; use the tabs at the bottom to change page.

Next step

Is work waiting between teams, or coming back for missing information?

Tell us what is happening. We agree priorities and scope before proposing any work.