Fabric Migration, Capacity & Cost Optimisation
Moving the platform is one job. Preserving reporting meaning and managing the running cost are others. These engagements show how each was approached.

These are separate engagement records, not stages of one client project. Each result belongs to its own scope and reporting period; the figures are not added together.
Redshift, Tableau & Kleene.ai to Microsoft Fabric
The warehouse, data preparation and reporting lived on three platforms. Retiring a licence only made sense once its work—and the reporting it supported—had a place in Fabric.
The migration brought those responsibilities together, with calculations and reporting periods reconciled before replaced dependencies were retired.
- Map Redshift warehouse, Kleene.ai preparation and Tableau reporting responsibilities.
- Move ingestion, preparation and modelling into the Fabric estate.
- Check reporting continuity before retiring replaced dependencies.
Reported saving
Saving amount · AUD · axis starts at zero
Approximate client-reported annual platform and licensing saving.
AI-assisted modelling for SQL Server to Fabric
Copying a warehouse can also copy its old assumptions. This engagement used source metadata and profiling to inform proposals for facts, dimensions and Fabric Silver and Gold structures.
AI assisted the proposal. Accountable human review determined the grain, relationships and measures before adoption.
- Use SQL Server structures and record behaviour as source evidence.
- Propose the model around the reporting questions it must answer.
- Review the design and adopt it with agreed definitions and ontology.
Reported saving
Saving amount · AUD · axis starts at zero
Approximately AUD 40,000 reported legacy licence cost avoided. Period not stated by the client.
Match Fabric capacity to changing demand
Overnight processing and daytime reporting did not need the same allocation all day. The control policy used telemetry, smoothed consumption and workload windows to decide when to increase, hold or reduce capacity.
Approved limits, cooldown rules, logging, alerts and manual override kept the resize decision accountable. Workload optimisation came before buying more capacity.
- Observe usage and scheduled demand, not just a monthly average.
- Resize within workload-specific safeguards.
- Track cost alongside timely refreshes and usable reports.
Monthly capacity run rate
AUD per month · axis starts at zero
AUD 11,000 lower per month · 78.6% reduction
Approximate client-supplied monthly run-rate figures for this engagement. This is a monthly comparison, not an annual savings claim or a universal Fabric benchmark.
Our methodology
- 01DiscoverAgree the outcome, the decisions and the requirements.
- 02Current stateMap how the work and data flow today, with evidence.
- 03Root causesFind what drives the delay, rework or disagreeing numbers.
- 04ApproachAgree the target design, scope and measures of success.
- 05BuildBuild the process change, model or report the design calls for.
- 06OptimiseTest at real volumes; tune speed, cost and usability.
- 07ProductioniseRelease with managed deployment, monitoring and support.
- 08GovernSet owners, access and controls so it keeps working.

Steps in this diagram
Lanes: Move, Improve, Operate.
- Workload case
- Inventory sources, models, reports
- Evidence-led model (02)
- Cover + reconcile (01)
- Controlled cutover
- DAX, refresh, workspace tuning
- Capacity policy (03)
- Operating review
- Run + improve
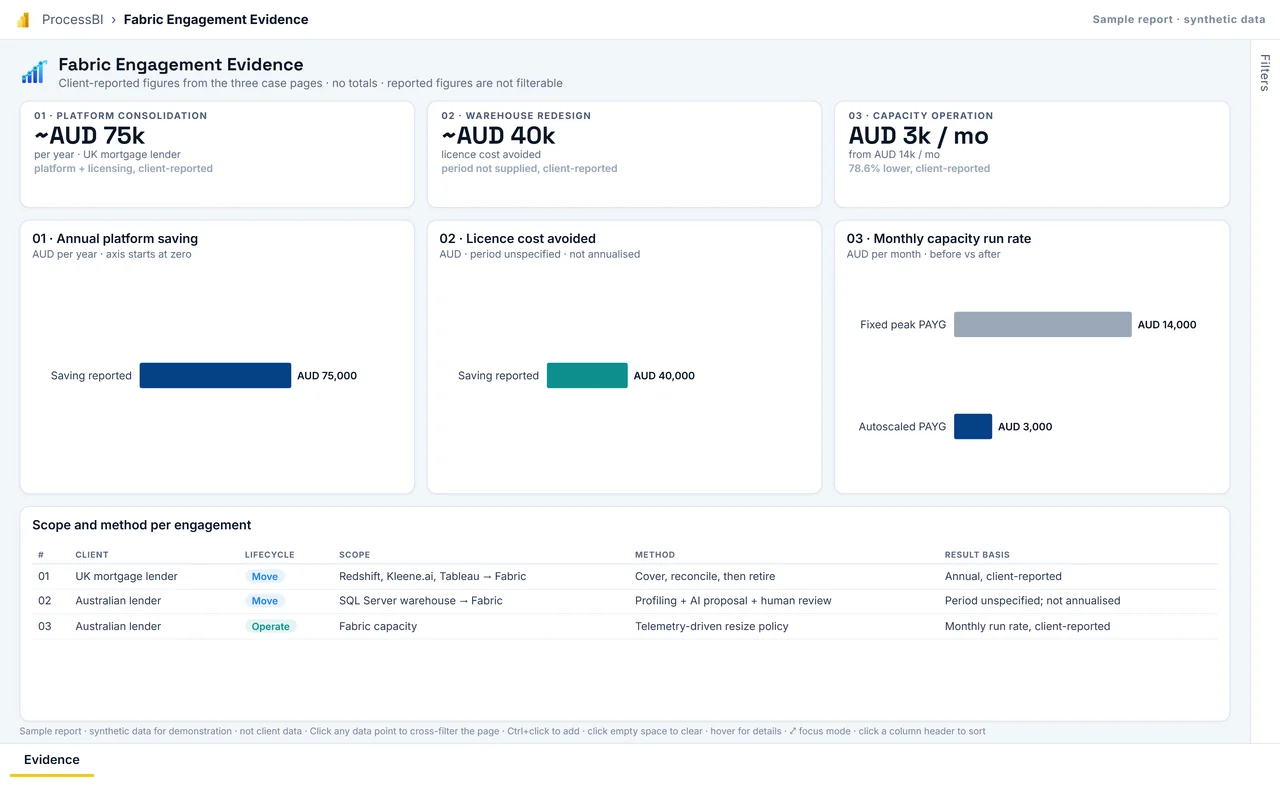
Synthetic sample data, not client data.
Planning a move to Fabric?
Tell us what is happening. We agree priorities and scope before proposing any work.