Waste reduction needed more than a process map
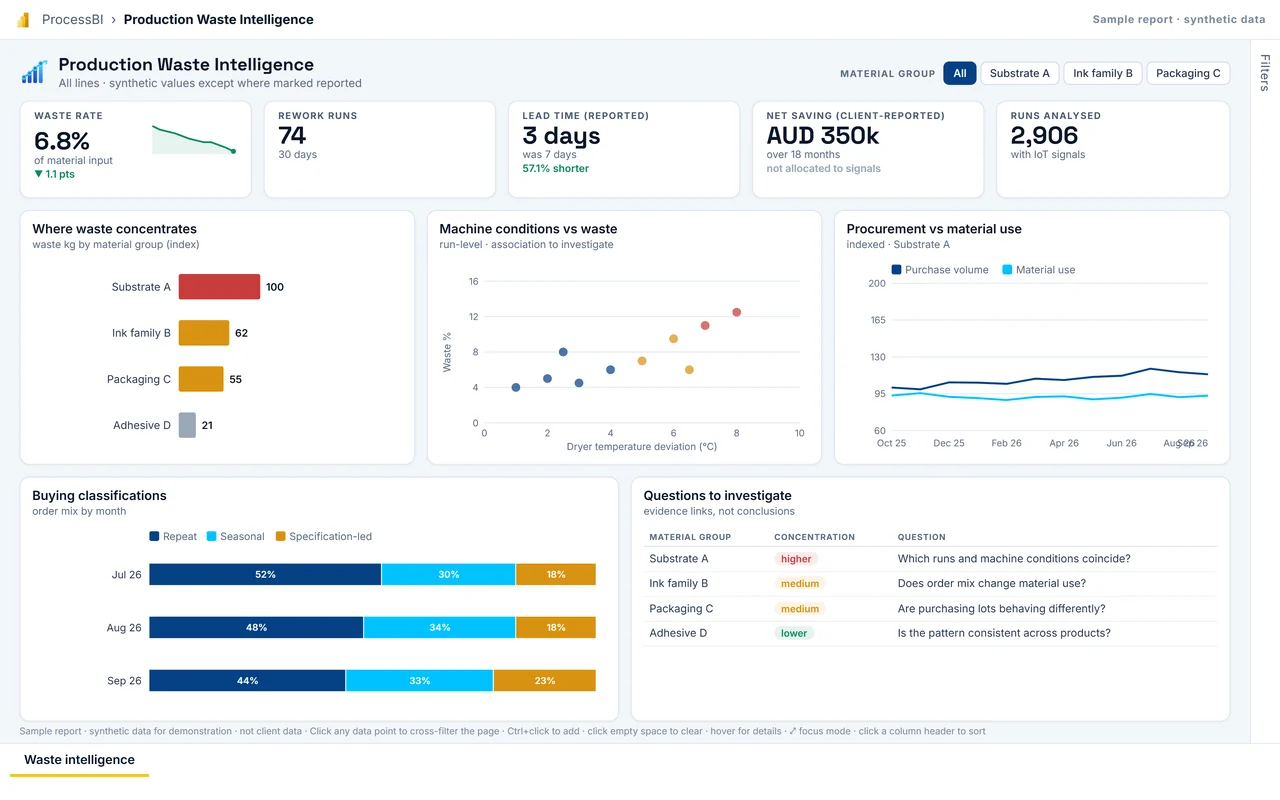
SQL analysis brought production and waste records together with machine data from IoT devices. Tableau helped the team see where inefficiencies appeared across materials, production conditions and the wider operating picture.
Procurement trends and customer buying classifications added context around material use and demand. The main focus remained waste reduction, while end-to-end production lead time showed whether the broader process was improving.
Use more than one lens on waste
Machine signals showed operating conditions around production events. Waste and rework records showed where the cost appeared, while procurement data added material price and purchase-volume context.
Customer buying classifications helped explain changes in product and order mix. SQL supported the analysis and Tableau made the combined patterns easier to review before improvement decisions were made.
Less elapsed time, with savings reported separately
Reported lead time fell from seven days to three: four fewer days from start to completion. That is 57.1% shorter lead time, not an equivalent increase in throughput.
The programme also recorded a client-reported AUD 350,000 net saving over 18 months. Lead time describes how quickly work finished; the net saving describes the financial result over that period.
Our methodology
- 01DiscoverAgree the outcome, the decisions and the requirements.
- 02Current stateMap how the work and data flow today, with evidence.
- 03Root causesFind what drives the delay, rework or disagreeing numbers.
- 04ApproachAgree the target design, scope and measures of success.
- 05BuildBuild the process change, model or report the design calls for.
- 06OptimiseTest at real volumes; tune speed, cost and usability.
- 07ProductioniseRelease with managed deployment, monitoring and support.
- 08GovernSet owners, access and controls so it keeps working.

Steps in this diagram
- Order + artwork
- Material issue
- Finish
- Pack + dispatch

Steps in this diagram
- Order + artwork
- Material issue
- Finish
- Pack + dispatch

Components in this design
- Machine sensors (IoT devices)
- Production + waste (runs, scrap, rework)
- Procurement + sales (lots, orders)
- IoT Hub (device telemetry)
- Pipelines (daily batch)
- Eventstream (route + window)
- Eventhouse (run-level aggregates)
- Lakehouse (production + commercial)
- Semantic model (run grain)
- Waste intelligence (sample report on this page)
- Line monitor (live conditions)
Reference design: how this pattern is typically built on Microsoft services. Component choices for a specific engagement depend on the client's environment and existing licences.
Microsoft icons are used under Microsoft's terms. Icon notices
Synthetic sample data, not client data.
Fewer days to completion
Production lead time
Days from start to completion · lower is better
A four-day reduction in elapsed production time.
Reported saving
Saving amount · AUD · axis starts at zero
Reported net saving for the full 18-month period. No monthly series or individual cost allocation was supplied.
Is waste or lead time hiding in the process?
Tell us what is happening. We agree priorities and scope before proposing any work.