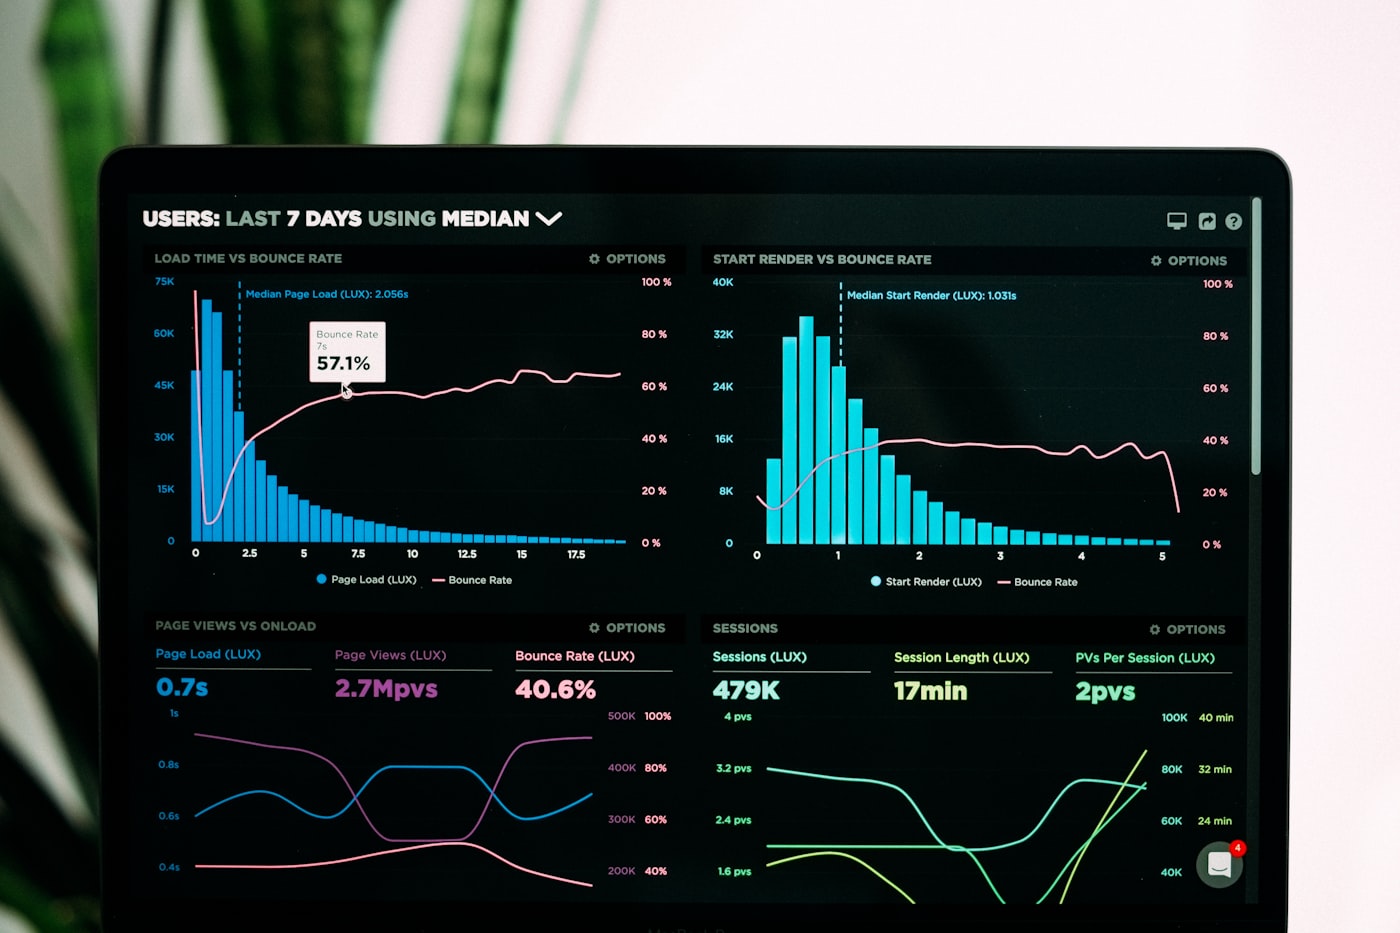
Inspection and process data turned into live SPC dashboards — quality control moves from a monthly audit into a real-time signal the line can act on.

Quality was reviewed after the fact. Defects were counted in a monthly spreadsheet, control charts were drawn by hand, and by the time a trend was visible the process had already produced a batch of scrap. Nobody could tell, in the moment, whether the line was in control.
End to end — how data moves from source to decision.
How we structured the work.
An illustrative view of the dashboards this engagement produces. All figures are sample data for illustration only — not client results.
Other engagements with a similar shape.

A QC programme with a properly designed statistical process, end-to-end DPMO measurement and automated reporting.

Fragmented plant reporting consolidated into one governed analytics model with a single set of trusted operational metrics.

A governed sales reporting model — one version of pipeline, revenue and win-rate the whole commercial team trusts.
Start with a conversation. We'll map the process, pressure-test the goal, and come back with a plan.
Get a Quote →