Measures do not agree
Clarify grain, definitions, filters, exclusions and ownership before rebuilding the visual layer.
Turn reporting questions into governed measures, usable Power BI reports and a delivery model your team can support after go-live.

Reporting becomes difficult when teams disagree about measures, source data cannot support the claim, refreshes fail without an owner or a report is technically correct but hard to use. We work back from the decision, define the meaning of each measure and build the reporting and controls around it.
Reporting, modelling and operation
Clarify grain, definitions, filters, exclusions and ownership before rebuilding the visual layer.
Separate source, model, DAX, visual, refresh and capacity symptoms, then test the measured cause.
Make workspace roles, access, release paths, endorsement, lineage and change ownership explicit.
Reconcile the new result against source records and existing reports before changing the business path.
From the reporting question to models, apps and agents that run on it
Define the management questions, measures, dimensions, exceptions and acceptance criteria the reporting must support.
Design grain, relationships and governed calculations so reports use the same business meaning.
Build clear report journeys that connect headlines to the records and exceptions behind them.
Reproduce the problem, identify its largest contributor and retest timing without changing the meaning of the result.
Set out ownership, access, workspace structure, deployment, monitoring and the route for changing governed measures.
Check totals, filters, access and refresh behaviour, then provide documentation and a supportable operating path.
Design large and composite semantic models, and consolidate overlapping datasets into fewer governed models with one set of measures.
Build a custom visual when the core visuals cannot show the decision, and a custom Power Query connector for a source without a built-in one.
Use the Rayfin CLI and SDK to build web data apps on Fabric that read the governed semantic model, for workflows a report page cannot serve.
Define business entities and relationships once in a Fabric IQ ontology, starting from existing semantic models, so people and AI agents use the same meaning. The ontology item is in preview.
Build Copilot Studio agents and Fabric data agents that answer from the governed model and respect its permissions.
Evidence from delivered engagements
More than 150 spreadsheets became one shared quality database, with Power BI supporting analysis of quality, cost and productivity.
Power BI reporting, process automation and data-pipeline work supporting major Australian superannuation funds.
A multi-domain platform programme including governed Power BI reporting and models, administration and clear reporting ownership.
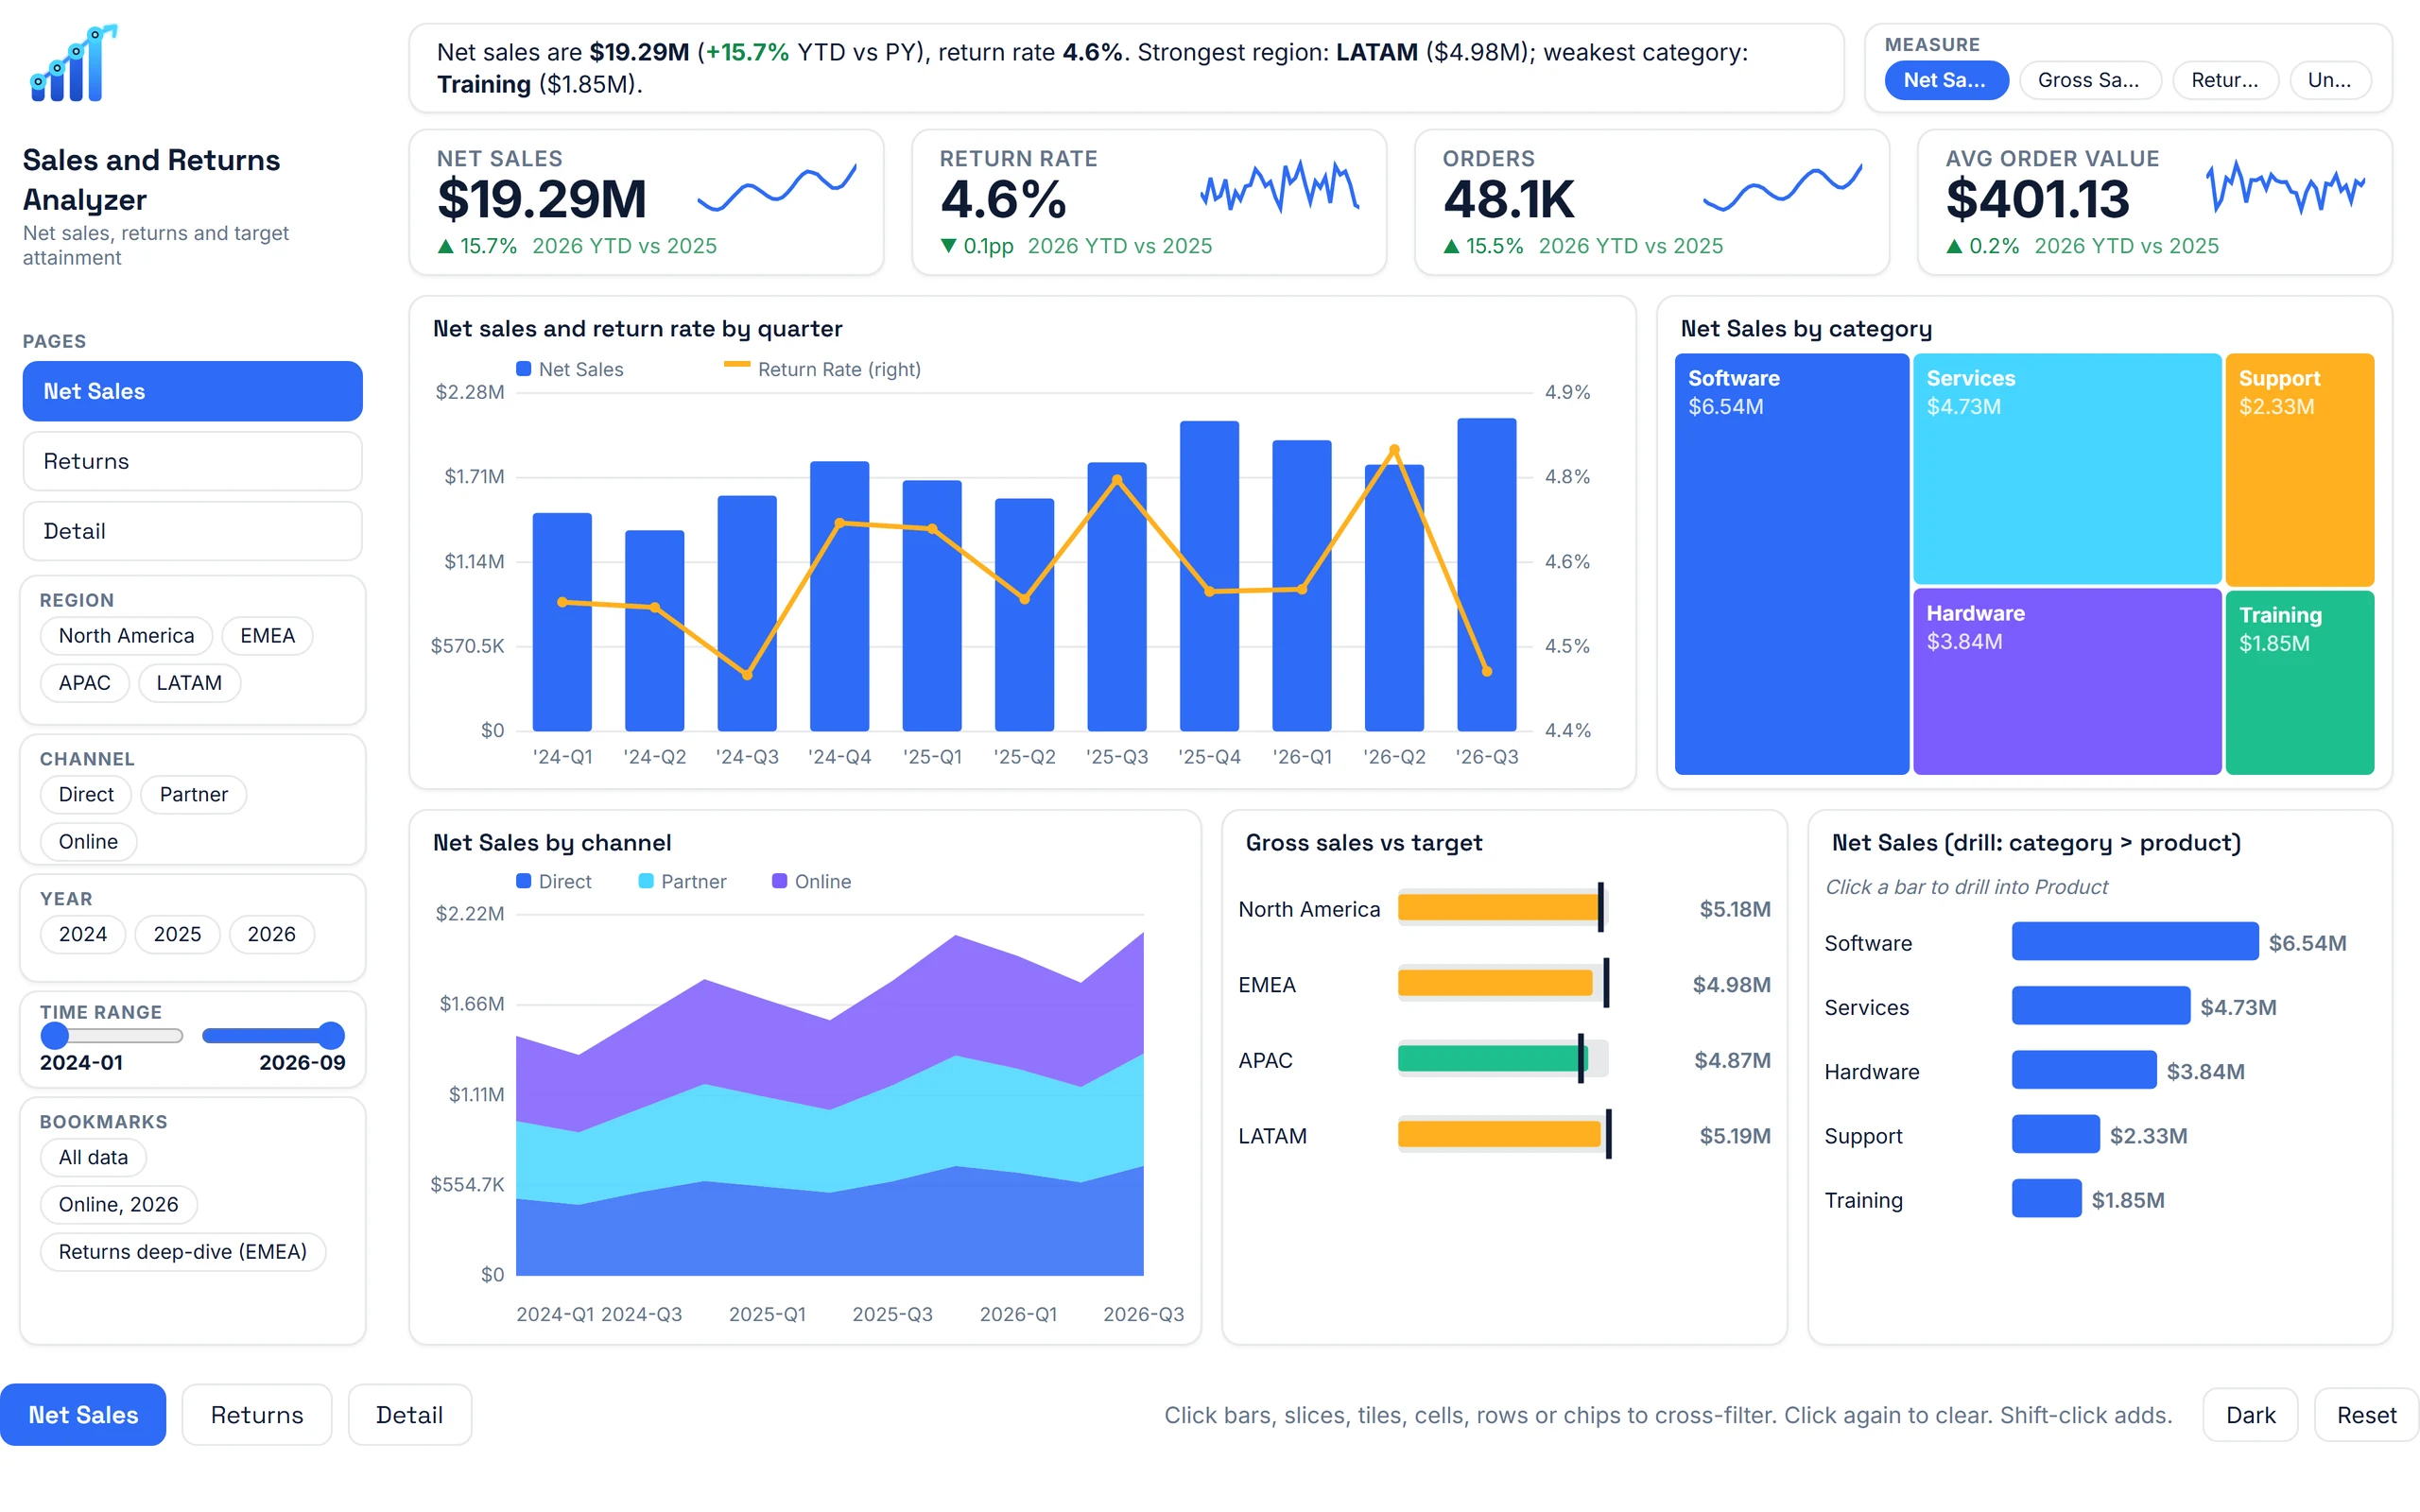
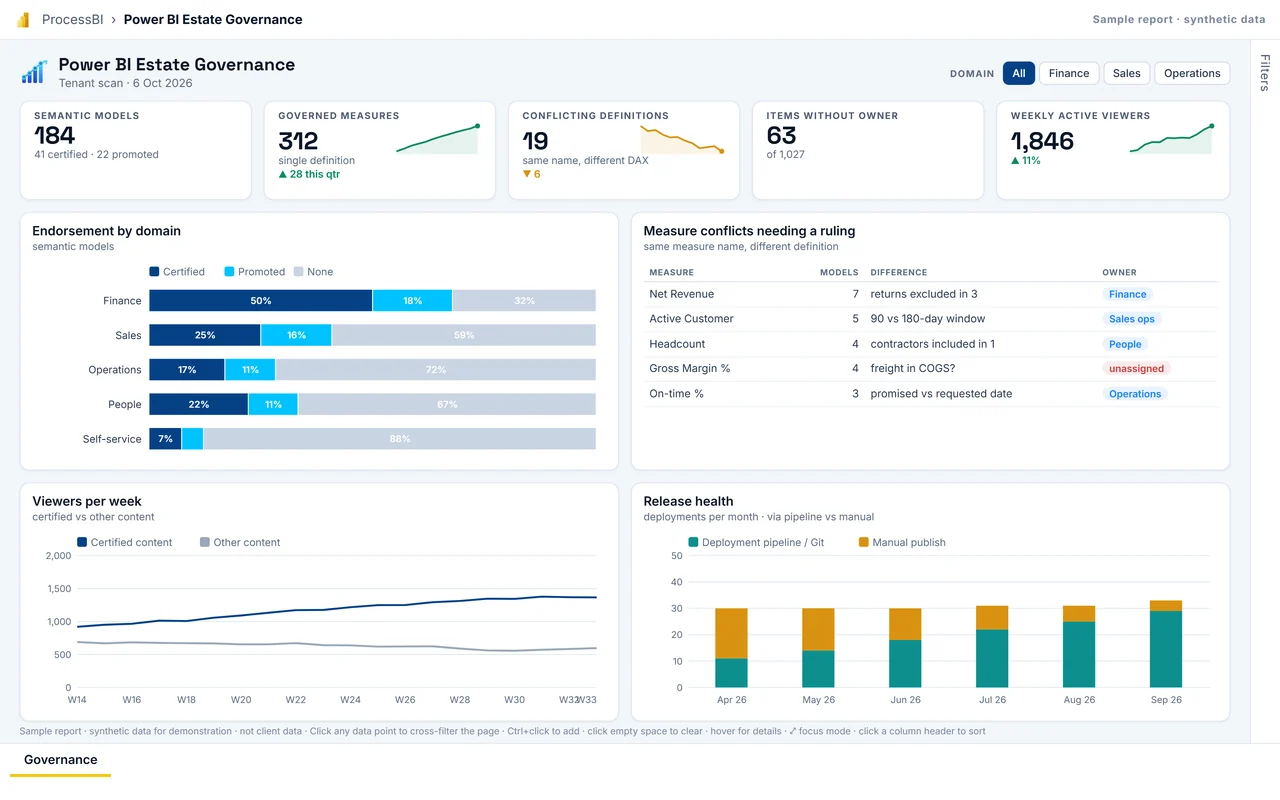
Two interactive sample reports, built the way we build for clients. Explore one here or full screen; the full catalogue of twenty live dashboards is on the Demos page.
Synthetic sample data. Click any bar, point or row to cross-filter; hover for details.
Use the narrower service when it fits

Lanes: Report user, Definition owner, BI developer, Release (pipeline).

Microsoft icons are used under Microsoft's terms. Icon notices
Synthetic sample data. Click any bar, point or row to cross-filter; use the tabs at the bottom to change page.
Tell us what is happening. We agree priorities and scope before proposing any work.