Fabric and Synapse overlap, but they are not interchangeable labels for the same architecture. Synapse commonly combines SQL, Spark, pipelines and Azure storage as separately operated services. Fabric brings several analytics workloads into a SaaS capacity model with OneLake as a shared storage foundation.
That difference can change deployment, support, cost allocation and the route from data to Power BI. It does not remove the need to engineer data, govern access or reconcile outputs.
Compare the operating model before the feature list
| Decision area | Synapse estate | Fabric estate |
|---|---|---|
| Platform shape | Azure services assembled and managed for the solution | SaaS analytics workloads sharing Fabric capacity and OneLake |
| Storage | Often ADLS plus workload-specific stores | OneLake foundation, with data-layer design still required |
| Cost model | Service-specific consumption and reservations | Shared capacity consumption monitored across workloads |
| Power BI | Serving stores accessed through Import or DirectQuery | Import and DirectQuery remain; Direct Lake may suit eligible models |
| Operations | Azure resource, network and service operations | Tenant, workspace, capacity and SaaS workload operations |
| Migration effort | Current state | Rebuild effort varies by SQL, Spark, pipeline and model compatibility |
Five tests for a defensible decision
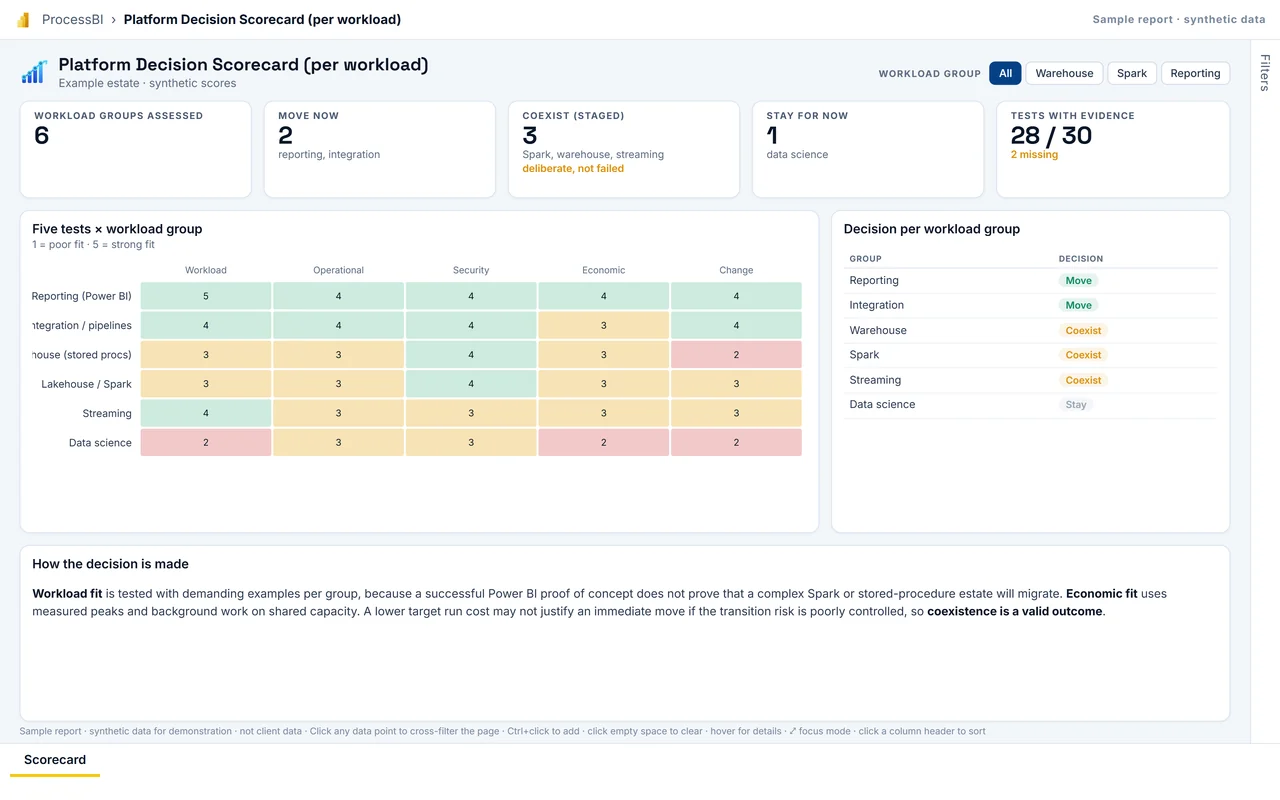
Workload fit. Separate warehouse, lakehouse, integration, streaming, data science and reporting workloads. Test demanding examples in each group. A successful Power BI proof of concept does not prove that a complex Spark or stored-procedure estate will migrate cleanly.
Operational fit. Compare deployments, identities, monitoring, incident response, support ownership and disaster recovery in each operating model. Simpler authoring is not the same as simpler production support.
Security fit. Map private connectivity, data residency, workspace separation, row-level security and privileged access requirements to the target design. Confirm current capabilities instead of relying on an old comparison matrix.
Economic fit. Measure representative peaks and background work. Fabric capacity is shared: pipelines, Spark, warehouse queries and BI activity can affect the same capacity. Synapse costs are distributed differently. Compare complete operating costs and required headroom.
Change fit. Account for test redesign, user acceptance, reporting continuity, team skills and decommissioning. A lower target run cost may not justify an immediate move if transition risk is poorly controlled.
When Fabric is a credible target
Fabric deserves serious evaluation when an organisation wants a more integrated Microsoft analytics experience, has Power BI close to the centre of consumption, can govern shared capacity and is prepared to redesign workloads rather than copy them mechanically.
Synapse may remain appropriate while critical dependencies, networking requirements or specialised workload behaviour are not yet proven in Fabric. A staged coexistence can be a deliberate architecture, not a failed migration.
Do not turn the comparison into the migration plan
A platform comparison establishes direction. A migration plan needs a verified inventory, dependency graph, target patterns, reconciliation controls, cutover sequence and rollback conditions. For that next step, use our Microsoft Fabric migration readiness guide.
ProcessBI’s process-first position is simple: the platform should make a real operating problem easier to manage. If the only stated benefit is that the technology is newer, the business case is not ready.
See the architecture and delivery story in our Fabric migration and optimisation case study. For a workload-level assessment, review our Fabric Migration & Power BI Optimisation service or contact ProcessBI.