Migration discovery & target design
Inventory warehouse structures, transformations, reports, semantic models and the business processes that depend on them.
Move data and reporting to Microsoft Fabric without losing business meaning. Then improve the Power BI estate and operate capacity around measured demand.

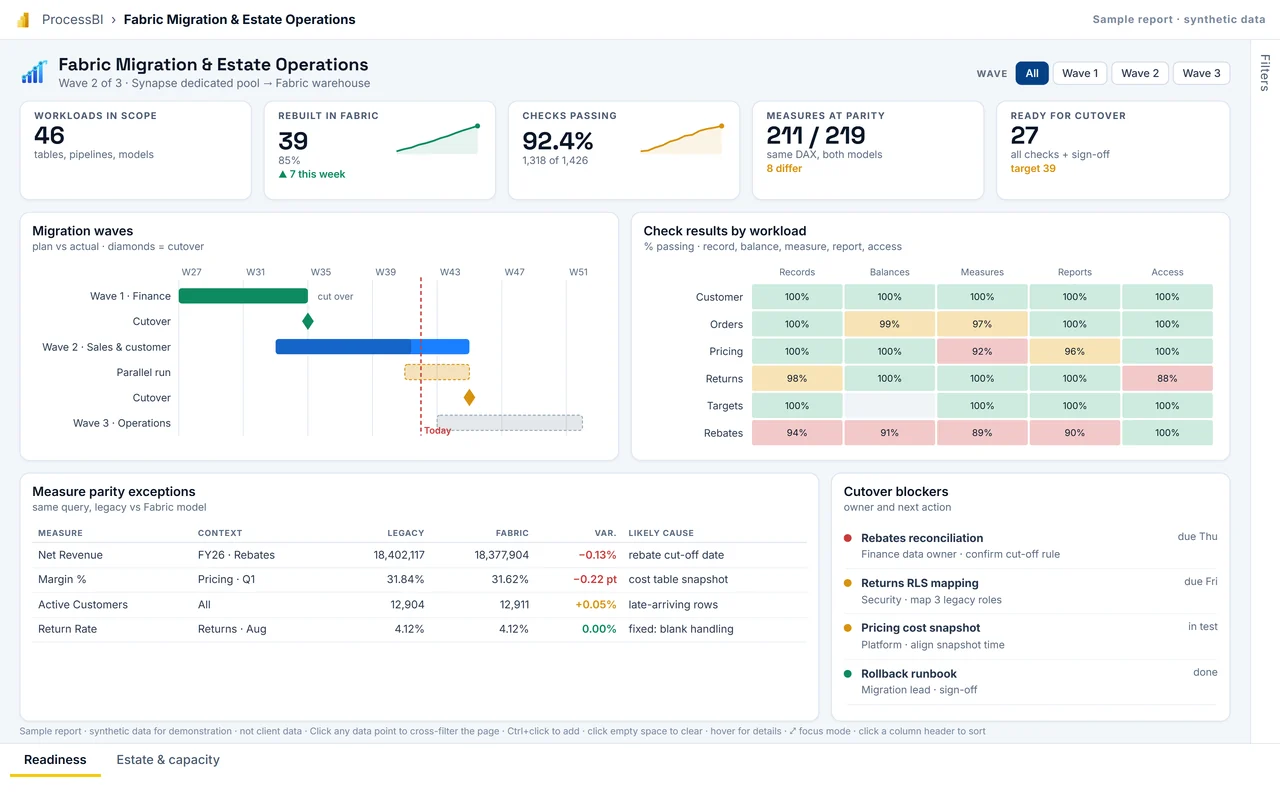
Moving tables is only part of the job. Measures, reports, permissions, refreshes and support arrangements also have to survive the move. We validate the old and new paths side by side before cutover.
More than 10 migrations delivered to Microsoft Fabric, mainly from Snowflake, Azure Synapse, Azure SQL and on-premises SQL Server.
Microsoft Fabric, Power BI & capacity operations
Inventory warehouse structures, transformations, reports, semantic models and the business processes that depend on them.
Move data and reporting in manageable stages, reconcile the new path and agree acceptance, rollback and handover.
Improve tenant and workspace design, semantic models, DAX, report behaviour and refresh reliability without separating performance from governance.
Connect utilisation, workload windows and service constraints to capacity sizing, scheduling, autoscaling policy and cost scenarios.
Investigate queries, processing patterns, job overlap and refresh design before treating more capacity as the answer.
Track why performance or capacity changed, observe the result and compare the estate with the agreed baseline.
Selected engagement evidence
A UK mortgage lender brought data preparation, warehousing and reporting responsibilities into Microsoft Fabric. The approximately AUD 75,000 annual platform and licensing saving is client-reported; the original total cost and vendor split were not supplied.
Metadata and data profiling informed proposed fact, dimension, Silver and Gold structures, with people retaining responsibility for grain, relationships and measures. Approximately AUD 40,000 in legacy licence cost was reported as avoided; the cost period was not supplied.
Telemetry, workload windows and service checks informed a responsive capacity policy. Client-supplied figures put the monthly run rate at approximately AUD 14,000 before and AUD 3,000 after; these are engagement figures, not a universal Fabric benchmark.
Related work across Fabric administration, migration, asset-data governance, real-time ingestion and Power BI reporting for an Australian electricity network. Outcome reported as delivered scope.
Discovery, delivery and handover
Map sources, transformations, semantic models, reports, identities, schedules and the business cycles that cannot be disrupted. The assessment can conclude that some workloads should stay where they are.
Agree data layers, workspace boundaries, ownership, security, deployment paths and capacity assumptions before rebuilding the estate.
Keep the existing path available while records, balances, measures, report behaviour and access are compared against agreed acceptance checks.
Agree rollback and support ownership, then tune refreshes, queries and capacity using evidence from real operation rather than design-time assumptions.
Architecture, guidance and demonstration
See how source ownership, ingestion, validation, OneLake data layers and reporting readiness fit into one governed path.
Explore a browser-based capacity policy using a synthetic workload example. Supplied engagement figures are identified separately from the demonstration data.
Work through the workload, controls, capacity, data-quality and cutover questions that should be answered before migration begins.
Compare the operating questions behind the platform decision rather than treating migration as a feature checklist.

Lanes: Migration team, Data owner, Business acceptance, Steering / CAB.

Microsoft icons are used under Microsoft's terms. Icon notices
Synthetic sample data. Click any bar, point or row to cross-filter; use the tabs at the bottom to change page.
Tell us what is happening. We agree priorities and scope before proposing any work.